1
2
3
4
5
6
7
8
9
10
11
12
13
14
15
16
17
18
19
20
21
22
23
24
25
26
27
28
29
30
31
32
33
34
35
36
37
38
39
40
41
42
43
44
45
46
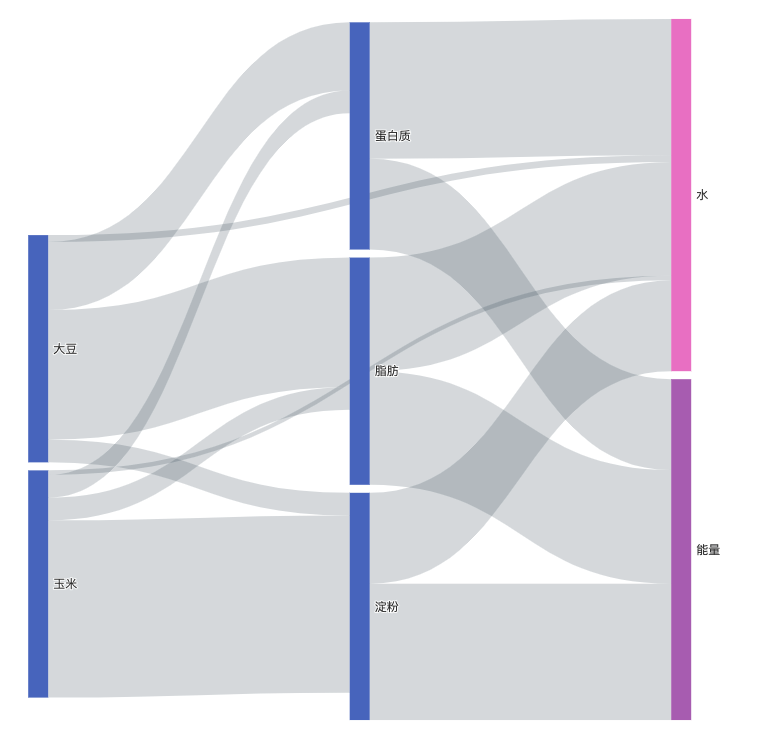
| //nodes: 所有会出现的节点
//links: 所有的关系线,source是左边节点,target是右边节点
var dataJson = {
"nodes":[{"name": '玉米'}, {"name": '大豆'}, {"name": '蛋白质'}, {"name": '淀粉'}, {"name": '脂肪'}, {"name": '水'}, {"name": '能量'}],
"links": [
{"source": '玉米', "target": '蛋白质', "value": 10},
{"source": '玉米', "target": '淀粉', "value": 78},
{"source": '玉米', "target": '水', "value": 2},
{"source": '玉米', "target": '脂肪', "value": 10},
{"source": '大豆', "target": '蛋白质', "value": 30},
{"source": '大豆', "target": '淀粉', "value": 10},
{"source": '大豆', "target": '脂肪', "value": 57},
{"source": '大豆', "target": '水', "value": 3},
{"source": '蛋白质', "target": '能量', "value": 40},
{"source": '蛋白质', "target": '水', "value": 60},
{"source": '淀粉', "target": '能量', "value": 60},
{"source": '淀粉', "target": '水', "value": 40},
{"source": '脂肪', "target": '能量', "value": 50},
{"source": '脂肪', "target": '水', "value": 50}
]
}
echarts.init(document.getElementById("myChart")).setOption(
(option = {
title: {
text: 'xxxx'
},
tooltip: {
trigger: 'item',
triggerOn: 'mousemove'
},
series: [
{
type: 'sankey',
data: dataJson.nodes,
links: dataJson.links,
emphasis: {
focus: 'adjacency'
},
lineStyle: {
color: 'gradient',
curveness: 0.5
}
}
]
})
); |

 关于本站
关于本站